Gene Ontology Ribbon
Want to try it now with your genes ? [ Access the GO Ribbon sandbox ]
A visual summary of gene functions
The GO Ribbon is a graphical tool to quickly browse the GO annotations for a gene or a gene set. It provides a visual summary of the functions of a gene (resp. gene sets) by grouping the GO annotations with high level terms selected to represent a broad range of functions (see slims/subsets).
The color gradient of each high level term (slim) varies from white to deep blue for increasing values. By default the color gradient informs on the number of available annotations for each high level term. A toggle allows to change the color gradient to inform instead on the number of distinct terms, giving a better approximate of the diversity of functions for the gene in that branch of the ontology.
To further investigate the GO annotations grouped by a high level term, colored cells are clickable and will display the associated table of annotations as shown below:
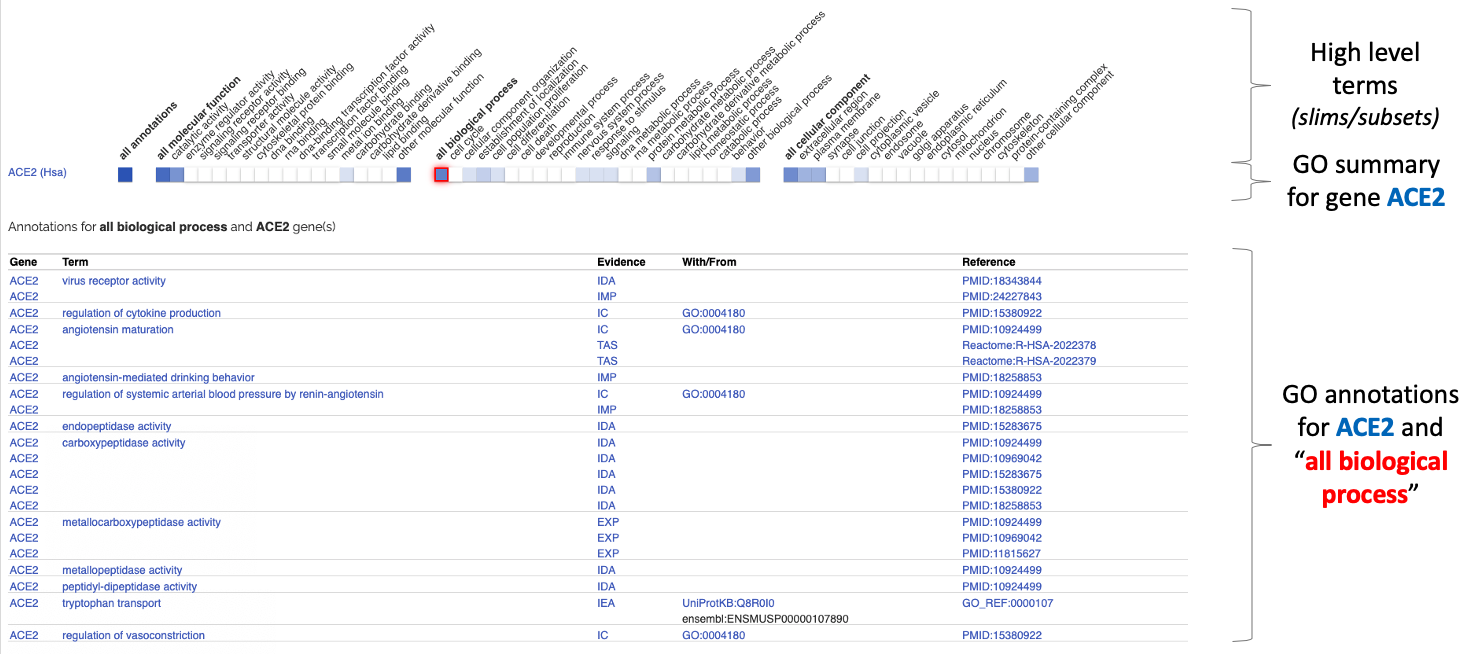
Detailed annotations table
The table of GO annotations shown above is similar to the one provided by our general browsing tool AmiGO but the ribbon table groups annotations by GO term and qualifier to provide a simpler display.
Each association between the gene and the GO term is supported by a reference (usually a PMID article) and an evidence code from ECO represented by a 3 letter codes (eg. IBA, IDA, ISS, etc) which informs for instance if the function was derived from an experiment or phylogenetic inference.
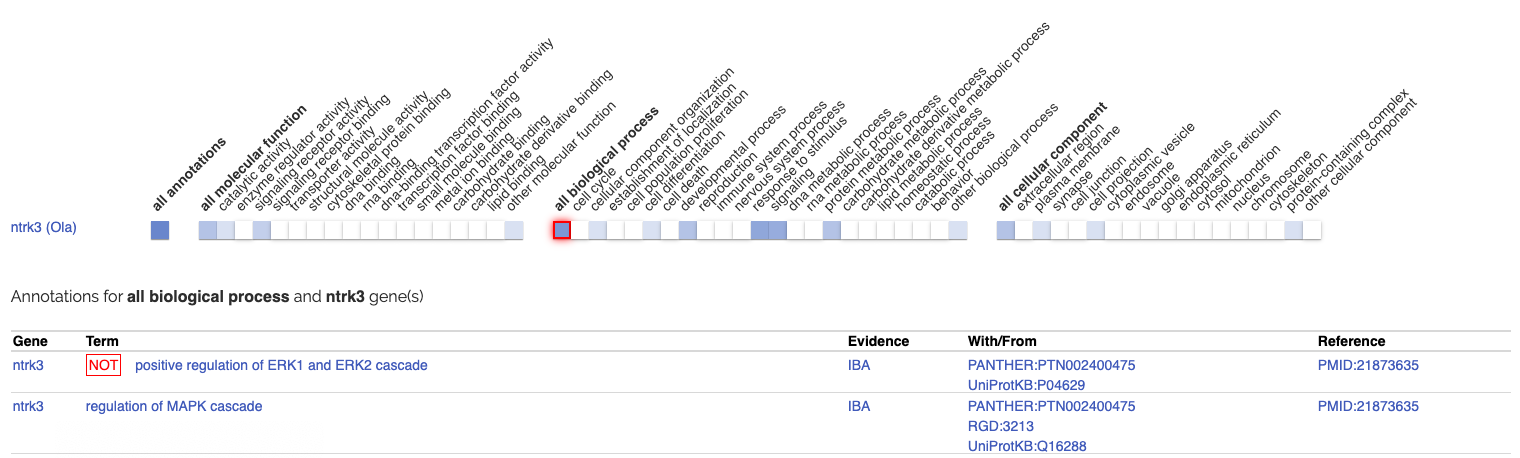
In addition, GO annotations sometimes inform when a gene can not exhibit a specific function. This is shown in a similar way in both AmiGO and the ribbon by adding the NOT qualifier tag in front of the GO term:
GO Ribbon with gene sets
The summaries provided by the GO Ribbon can be used to quickly highlight the similarities and differences between genes of a gene set. These gene sets generally come from a:
- set of differentially expressed genes
- set of interactors
- set of orthologs
The visual summary of a gene set through the Ribbon can help identify shared functions or sub clusters of genes exhibiting different behaviors.
GO Ribbon is not GO Enrichment
The GO Ribbon is designed to provide a visual summary and a simpler way to navigate GO annotations. For gene sets, the GO Ribbon will show the functions shared between genes, but it will not inform on the statistical relevance (over/under representation) of such functions in the gene set. Statistical significance and bias of biological functions have to be examined through over representation tests and enrichment analysis.
Other ways to access GO Ribbons
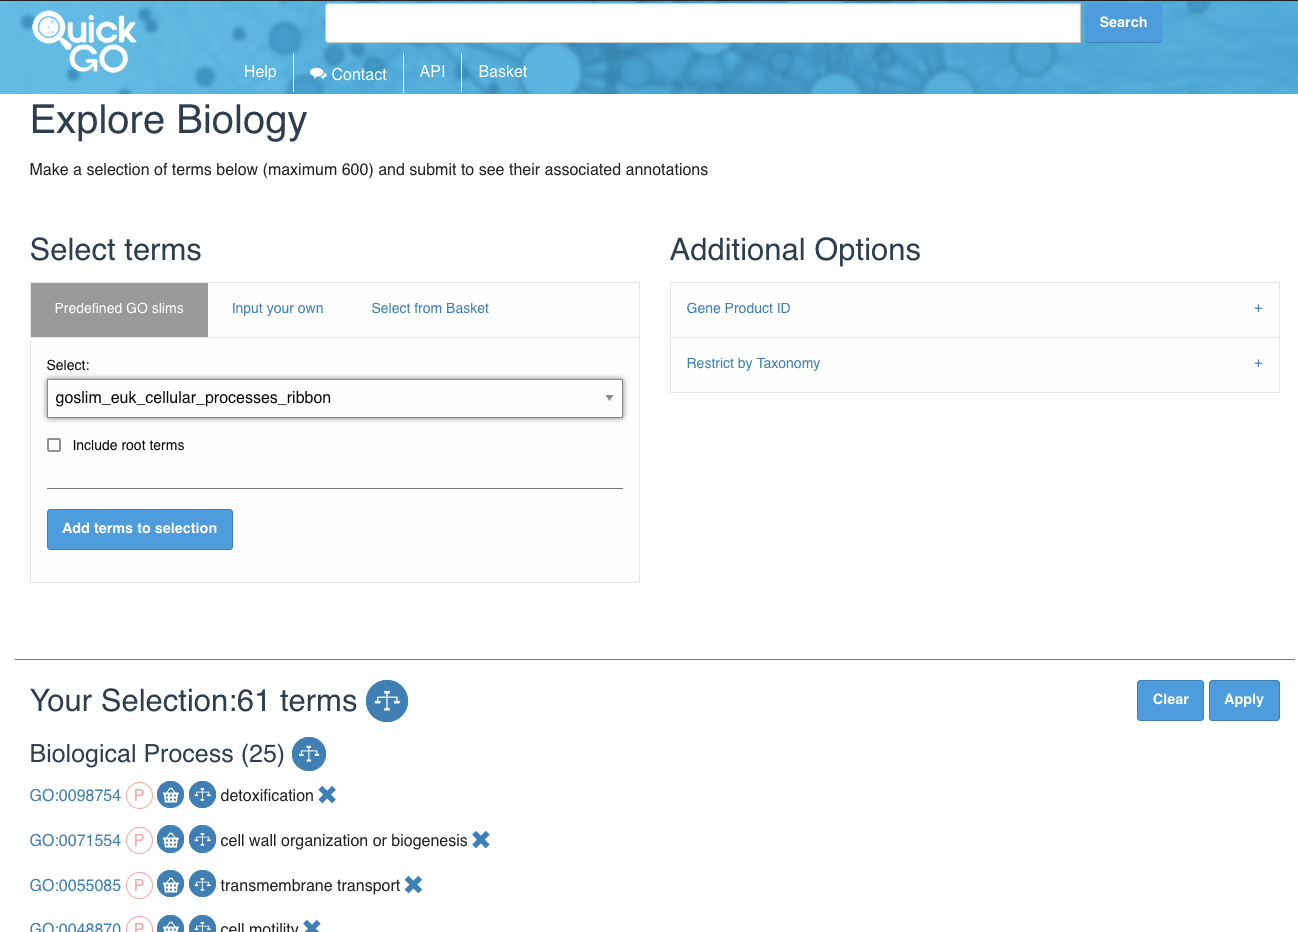
GO Ribbons specifically for eukaryotic cellular processes, plants, and prokaryotes are available on the QuickGO slimming page, as is a FlyBase-specific ribbon. To access these, click the “Explore biology” box on the QuickGO home page. Select a ribbon in the dropdown and click the “Add terms to selection” button, then Apply. You can filter the resulting GO annotations by IDs, taxon, and more.
Technical Information
Authorized IDs
The gene IDs generally recognized within GO are the ones provided by the Model Organism Database (MODs) in their GPI file.
As of July 2020, here are some examples of IDs:
- MGD: MGI:1099800
- RGD: RGD:3017
- SGD: SGD:S000004328
- WB: WB:WBGene00019240
- FB: FB:FBgn0035265
- ZFIN: ZFIN:ZDB-GENE-040113-2
- Homo sapiens: UniProtKB:Q9BYF1
For additional reference, GPI files can be downloaded from the GO release at http://current.geneontology.org/annotations/
Generic Ribbon, other usages and data model
The Ribbon has been designed as a generic and easy-to-integrate web component. As such, it can represents a variety of data types and be integrated in any website independently of the technologies/frameworks used.
The Ribbon is used for instance within the Alliance of Genome Resources to display both GO, Disease and Expression data.
The data provided to the ribbon has to follow a certain JSON schema and a basic example is shown below. It is composed of two top level fields “categories” and “subjects”. “categories” contains the data to represent the structure of the ribbon strips (eg how many categories, how many groups/terms under each category) while the “subjects” field contains the number of annotations for each gene and each of the terms described in “categories”:
{
    "categories": [
        {
            "id": "cat1-id",
            "label": "cat1-label",
            "description": "",
            "groups": [
                {
                    "id": "cat1-gp1-id",
                    "label": "cat1-gp1-label",
                    "description": "",
                    "type": "All/Term/Other"
                },
                ...
            ]
        }
    ],

    "subjects": [

    ]
}
Ribbon Data Model Examples
Under the hood
The GO Ribbon is available as part of the GO Web Components package on [ GitHub ] and [ NPM ]. It includes all the components needed to display and interact the ribbon strips and table and is pre-configured to fetch data from the GO API. This version can easily be integrated in any website or framework. Additional information is available in the documentation.